Please follow this space for updates on features of our work in news and media outlets.
Also, if you have seen any news feature about the Global Healthy and Sustainable City-Indicators Collaborative, the Global Observatory for Healthy and Sustainable Cities, or the 2022 Lancet Global Health Series on Urban Design, Transport and Health, please send it to us to info@healthysustainablecities.org and we will make sure to feature it in this section.
Healthy By Design: Transforming Urban Spaced for Health With Dr. James Sallis
Featured in Healthy Neighborhoods, Healthy Nation Podcasts, Jan 01, 2024.
From Down Under to Around te Globe: A Vision for Healthier Cities with Melanie Low
Featured in Healthy Neighborhoods, Healthy Nation Podcasts, Feb 12, 2024.
Around the world, cities are falling short on health and sustainability goals
Feature in Brookings, Nov 16, 2022
Talking Headways Podcast: How Walkable Cities Foster Public Health
Feature in Streets Blog USA, Sep 22, 2022
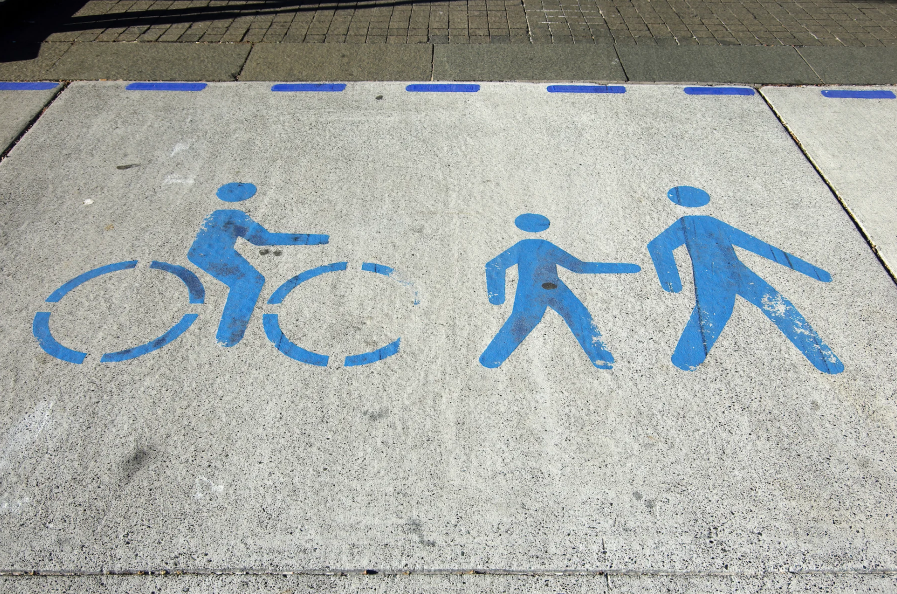
Australian cities failing on walkability
Feature in Pursuit, July 5, 2022
La revista The Lancet puntúa a València como una de las mejores ciudades del mundo en apoyo a la salud y sostenibilidad
Feature in University of Valencia, May 14, 2022
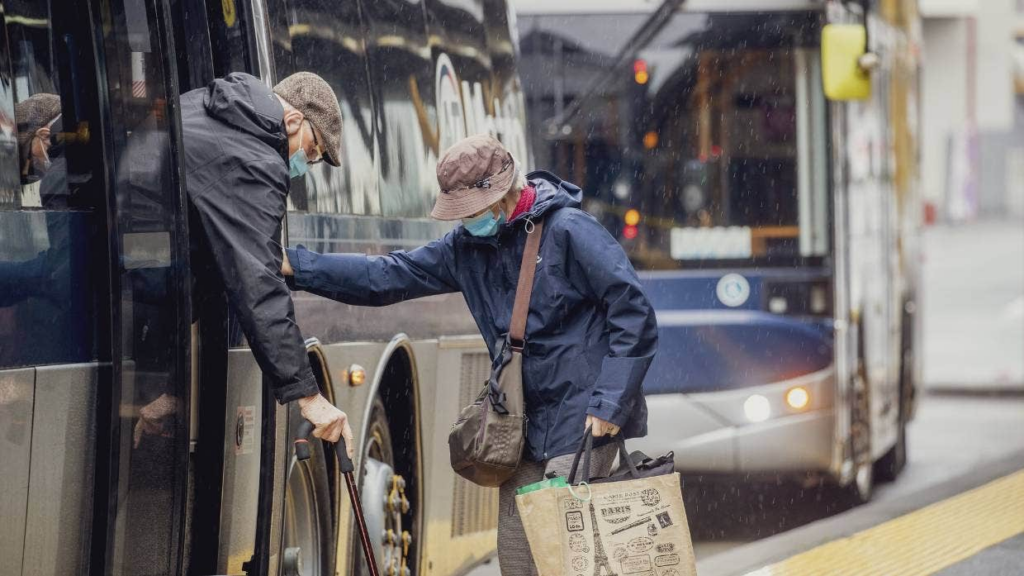
Auckland lacking health-focused public transport policy – study
Feature in Stuff, May 13, 2022
Odense fremæves i anerkendt tidsskrift
(from minute 8:53)
Feature in TV2 FYN, May 12, 2022
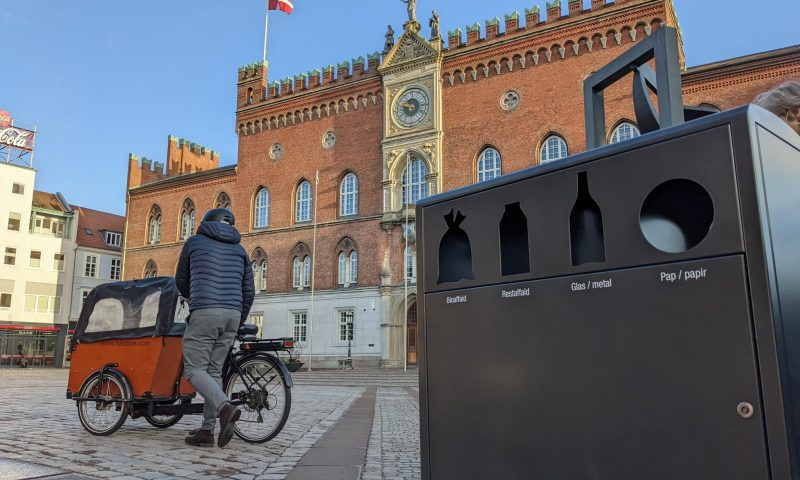
Helt vildt: Odense er blandt verdens sundeste og mest bæredygtige byer
Feature in Migogodense, May 12, 2022
Dansk by får stor ros i internationalt tidsskrift
Feature in B.T. Nyheder, May 12, 2022
The Lancet: Odense er i verdenseliten som sund og bæredygtig by
Feature in Avisen and Local Eyes, May 12, 2022
Odense fremhæves i internationalt tidsskrift
Feature in TV2 FYN, May 12, 2022
Research finds Aussie cities fail to meet health and sustainability thresholds
Feature in Goverment News Australia, May 12, 2022
Transport survey: Aucklanders waiting too long for buses, research finds
Feature in Nzherald.co.nz, May 12, 2022
Building a global system to measure sustainable cities
Feature in University of Melbourne, May 11, 2022
You are now being redirected to our indicator tools and software website. We recommend saving or bookmarking the URL to access it directly next time
10
Your team can continue to work together to advocate for progress and serve as a resource for city leaders.
Repeating the calculation of indicators every few years provides occasions to celebrate progress, identify continuing, and update goals.
9
You are now ready to organize one or more meetings or events to present results to city leaders and encourage their use in setting goals to improve policies and environments in your cities.
It is useful to have people from multiple sectors involved in the presentations.There are recordings of local events in which indicators are presented to city leaders on the website.
8
Send your city’s finalised Scorecard and/or Report to info@healthysustainablecities.org, for upload to the Global Observatorywebsite.
Your city will officially be included in the 1000 Cities Challenge, and city teams will become part of our Global Healthy and Sustainable City-Indicators Collaboration.
7
Check your data and indicator results to ensure they are as accurate as possible. Validation checklists and the Global Observatory team will assist with validation.
Please contact our team for support: info@healthysustainablecities.org
6
Use the GHSCI Software to:
Metropolitan transport policy with health-focused actions
Air pollution policies for transport and land-use planning
Requirements for public transport access to employment and services
Employment distribution requirements
Parking restrictions to discourage car use
Minimum public open space access requirements
Street connectivity requirements
Provision of pedestrian infrastructure and targets for walking participation
Provision of cycling infrastructure and targets for cycling participation
Housing density requirements
Minimum requirements for public transport access and targets for public transport use
Publicly available information on government expenditure for different transport modes
Population with access to fresh food market or supermarket
Population living in neighbourhoods above minimum density threshold for WHO physical activity target
Population with access to regularly running formal public transport (<20 mins)
Population living in neighbourhoods above the median walkability across cities
Population living in neighbourhoods above minimum connectivity threshold for WHO physical activity target
Population with access to any public open space
5
Data | Purpose | Required |
---|---|---|
OpenStreetMap | OpenStreetMap .pbf file with coverage of the region (and time) of interest; this could be an historical planet file, or a region-specific excerpt | Yes |
Population Grids | Population distribution raster grid or vector data with coverage of urban region of interest. GHS population grid (R2023) is recommended | Yes |
Region Boundary | Vector boundary for identifying study region (e.g. geopackage, geojson or shp). | Conditional |
Urban Region | Global Human Settlements Layer Urban Centres database and/or administrative boundary for urban region of interest | Conditional |
Transit Feeds | Collections of zipped GTFS feeds to represent public transport service frequency | No |
Other | Other custom data, such as points of interest | No |
Further information and guidance on how to collect policy and spatial data is available on the Global Observatory website, Resources tab
4
The Global Observatory team, including country/regional coordinators can act as mentors or guides and will be able to answer questions related to the data collection plan, policy and spatial indicators computation, and generation of the Scorecard and Report.
3
2